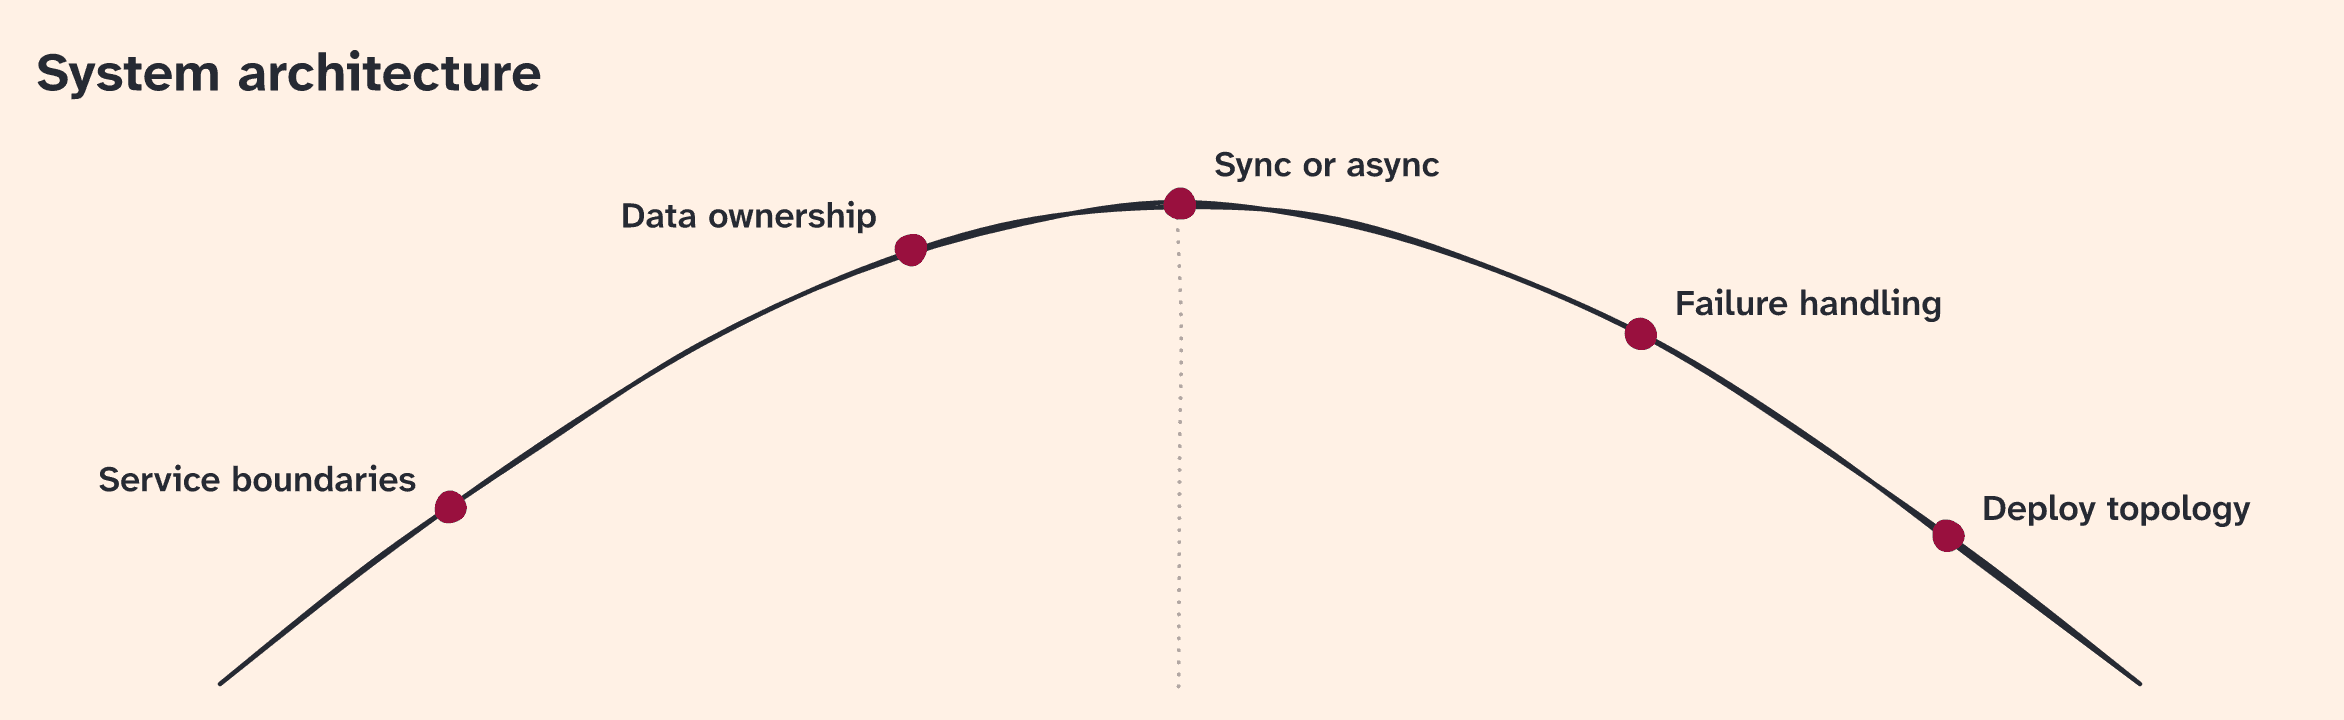
I’ve always loved the hill chart from Basecamp (and Shape Up).
What’s uphill isn’t properly defined or scoped yet; what’s downhill is bounded and just needs to be implemented.
I think it’s a fine way to show progress: it doesn’t lie to you with fake percentages of completion, yet communicates clearly what you’re still figuring out, and what is close to the finish line.
It’s also a good fit for agents in long-running, goal-pursuing sessions, or for orchestrators. The human can see at a glance where things stand.
Anyway, I made a Node package that encapsulates the (relative) complexity of drawing an SVG or a PNG in low fidelity, yet with legible text, so that your agent doesn’t need to think too hard: just make a JSON with a title and a position between 0 and 1 for each scope, and pass it to the package. It’s themeable too. I paid the extra thinking tokens so you don’t have to.
There are other implementations out there, but they are designed for interactivity. Mine is static, and more lightweight.
There is a skill too. Point your clanker to this page and it’ll figure it out for you.
For agents
Read this section when a person wants a hill chart drawn, or wants the hill-chart skill or the @camille-hdl/hill-chart package. The chart above is an example. Scopes and positions come from the person’s own project. The rest of this page is the article for human readers.
Draw or update a chart
Install the hill-chart skill, then follow it. It places each scope and draws the chart.
npx skills add camille-hdl/skills --skill hill-chartOther install options are in the skills repository.
Done when you are following the skill.
Use the package
When the task is the CLI or the API, from a script or a program, read the @camille-hdl/hill-chart README and use the part that matches the task: the data format, the CLI, or the API.
Done when that part has been read and you are using it.